
Link : Trade Conflict in the age of Covid-18, VoxEU
Richard Baldwin & Rebecca Freeman, 22 May 2020
International trade has helped many nations get vital medical supplies during this pandemic, yet a number of new, protectionist initiatives have been taken or discussed which could disrupt global value chains. This column presents calculations showing that national manufacturing sectors all across the globe are highly interdependent, that these connections have risen since the 2008/9 crisis, and that China is pivotal in the network of dependencies. Given this, policies that seek to hinder supply-chain trade could prove costly.
International trade has been essential to pandemic-fighting efforts by nations across the globe. For example, during the critical phase of their outbreaks, Western nations were able to import millions of masks and other personal protective equipment (PPE) from Asian nations who were recovering from their initial outbreaks and lockdowns (Bown 2020a, Fiorini et al 2020). China was the source of about half of US PPE imports before Covid. Chinese exports of PPE to the US fell by 19% (relative to the same period last year) when it was suffering its worst outbreak, but with workers returning to factories from March, China rapidly scaled up production and exports. By late March, it was making 12 times more masks than it was making in 2019 (Bown 2020b). Moreover, buyers in the West have been able to import from non-traditional exporters such as Sri Lanka, Thailand, Dominican Republic, Honduras, and Vietnam (Bamber et al 2020).
Despite the positive role trade has played, the Covid crisis has witnessed the rise of several protectionist policies (González 2020). For instance, many nations imposed export restrictions on medical supplies in an effort to boost local availability (Figure 1). And the possibilities of further and wider trade restrictions have multiplied as US-China trade tensions have reignited.
More broadly, some policymakers are calling for greater self-reliance in general and repatriation of international supply chains in particular. The US Trade Representative Robert Lighthizer wrote last week, “businesses have been rethinking the way that overextended, overseas supply lines expose them to unacceptable risk … the era of reflexive offshoring is over… ” (Lighthizer 2020). Similar sentiments were expressed in a 17 April 2020 resolution in which the European Parliament declared it “supports the reintegration of supply chains inside the EU” (European Parliament 2020).
In this column, we argue that policies geared towards restricting exports and dismantling supply chains could backfire with negative consequences for trade in both the short and long term – and not just trade in medical equipment. Our argument is based on three facts. First, the interdependence of national manufacturing sectors is pervasive. Second, it has grown substantially in recent years. And third, China plays a unique role in the global network of trade in intermediate inputs.
Figure 1 Export controls on medical supplies and medicines reported in 2020: 83 nations have imposed a total of 150 measures
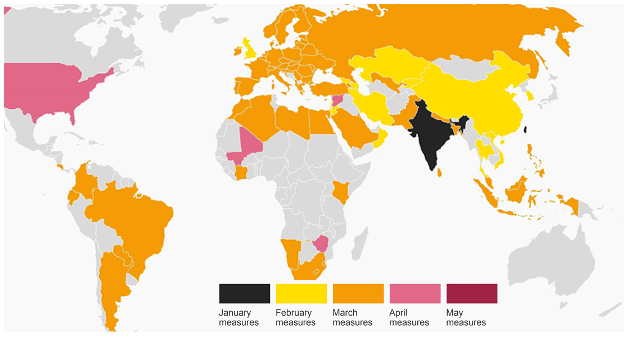
Source: Global Trade Alert website, https://www.globaltradealert.org/, accessed 9 May 2020.
Measuring interdependence
The question: “How integrated are national manufacturing sectors” does not have a single answer. By some measures, global value chain expansion stopped a decade ago (Kilic and Marin 2020). Broader indicators, however, tell a very different story. The dependence of one nation’s manufacturing sector on intermediate inputs produced in another nation is one such measure.
For example, the US produces motor vehicles using parts imported from China. The value of Chinese inputs as a share of US output is thus a straightforward measure of integration. While crude, this indicator has many merits. For one, it is observable as its numerator comes from trade data and its denominator comes from national accounts. For another, it gives a first-order indication of how disruptive it would be for the US auto industry to cut all trade ties with China. As Figure 2 shows, the ‘observed reliance’ gauge of dependence has been increasing since 2005.
Figure 2 Observed and total reliance of US motor vehicle sector on Chinese inputs
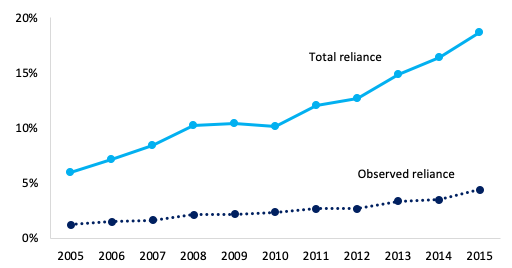
Source: Authors’ computations based on OECD ICIO Tables (available online at: https://www.oecd.org/sti/ind/inter-country-input-output-tables.htm).
Notes: See annex for explanations; authors’ calculations available upon request.
The direct measure, however, misses important aspects of manufacturing dependence (Baldwin and Freeman 2020). It leaves out all the indirect dependencies that arise from trade with third countries. China, for example, is a major supplier of auto parts to Germany, Japan, Mexico, and Canada. These countries in turn use the Chinese inputs when making auto parts and components that they sell to US-based automakers. Putting together direct and indirect linkages, we get the ‘total reliance’ indictor (see Annex for details). Figure 2 shows that in the US-China auto sector case, total reliance is several times larger than the observed reliance. It has also been growing more rapidly than observed reliance.
But why has international reliance been growing? As it turns out, much of this increase in interconnectedness is explained by the rising importance of Chinese intermediate inputs. It is well-known that Chinese manufacturing as a share of world manufacturing has more than doubled since 2004 (Figure 3, top-left panel). What is less well known is that much of this new manufacturing capacity produces intermediate goods that are exported worldwide. The other panels in Figure 3 illustrate this by focusing on the world’s three manufacturing hubs: Germany, the US, and China.
The top-right panel of Figure 3 uses the total reliance indicator to show German reliance on imported intermediates from the US, China, and Japan. The most salient feature is the way that German manufacturing has tripled its reliance on Chinese inputs while its reliance on the two other leading manufacturing nations has remained relatively flat. The same is true for the US (bottom-left panel), but the level of US reliance started out twice as high as Germany’s.
The real asymmetry in Figure 3 is found in the bottom-right panel. This shows that China’s reliance on inputs from the US, Germany, and Japan have been falling, not rising – especially for inputs from Japan. The asymmetric evolution means, for example, that in 2015 about 9% of US manufacturing output comprised inputs made in China, while inputs imported from the US amounted to only 2% of Chinese manufacturing output.
As it turns out, this asymmetry holds for most major manufacturing nations. China’s emergence as a central player in international supply chains is true more generally as Figure 4 shows.
Figure 3 Total reliance of GVC hubs’ manufacturing production on top manufacturing nation’s inputs and world manufacturing shares
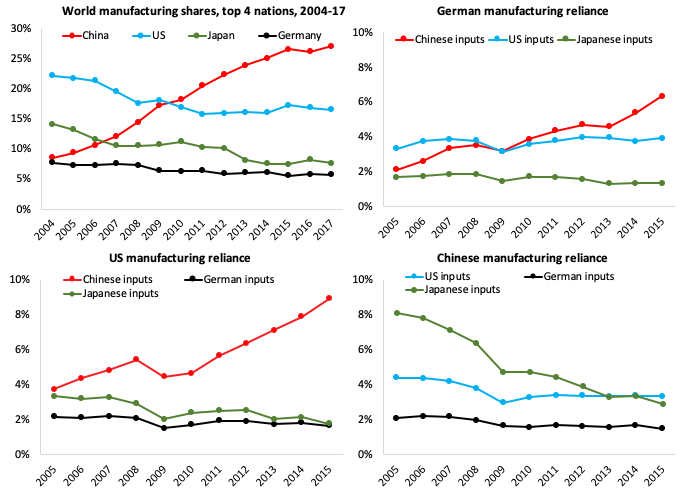
Source: Manufacturing shares from World Development Indicator online database. Reliance computations by authors, based on OECD ICIO Tables (https://www.oecd.org/sti/ind/inter-country-input-output-tables.htm).
Notes: The figures are the share of direct and indirect inputs from the each GVC hub in the other hub’s total manufacturing output.
China as the workshop of the world
Figure 4 arranges importing nations down the rows and supplying nations across the columns. The numbers represent the percentage point difference in total reliance shares between 2015 and 2009. For example, the 3.0 in the row for Canada (CAN) and column for the USA indicates that Canada is more reliant on US inputs than it was in 2009, with the increase being 3.0 percentage points in the total reliance measure. Small numbers are zeroed for clarity, and negative numbers are shown in blue, with darker blues indicating bigger drops in total reliance. The positive differences (i.e. increased reliance on a foreign nations’ inputs) are shown in a heatmap scale ranging from yellow (low) to red (high).
The unique role of China (CHN) in the evolution of global supply chains shows up clearly in the fact that every element in China’s column is positive, and large. Every major manufacturing nation’s output is more reliant on Chinese inputs (China’s whole column is red). But China’s column is not the only remarkable feature. The US’s column contains many positive numbers and in the cases of Canada and Mexico (MEX) the numbers are large, but nothing like those of China; many of the figures are too small to show up. Germany’s column also has many numbers that are too small to show, and only a few positive numbers.
Regionalisation of supply relationships can also be seen in the figure. The three main regional supply networks – Factory Asia, Factory North America, and Factory Europe – are shown as the three boxes along the diagonal. Factory North America (the box including the US, Canada, and Mexico) has only red squares, which indicates increased regionalisation, but the increase is an asymmetric increase in the reliance of Mexican and Canadian manufacturing on US intermediate inputs. The changes within Factory Europe box (the middle box), are more moderate. The Germany column (DEU), is filled with positive numbers (with the exception of Switzerland, CHE), but most of the other cells are filled with very small numbers that have been zeroed, or small positive numbers. Factory Asia has also become more regionalised, but only due to the rising role of China.
Figure 4 Percentage point difference in row nation’s manufacturing sector reliance on column nation’s inputs, 2015 vs. 2009
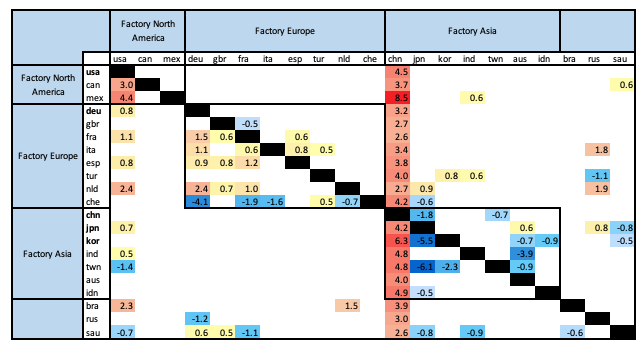
Source: Authors’ computations based on OECD ICIO Tables (available online at: https://www.oecd.org/sti/ind/inter-country-input-output-tables.htm).
Notes: Standard 3-digit ISO codes denote country names. The figures are the difference in the value-added share of direct and indirect inputs from the column nation in the row nation’s total manufacturing output. Differences greater than -0.5pp but below 0.5ppt are zeroed for clarity as are ‘own provisions’ on the diagonal. For example, the reliance of the GBR (the UK’s) manufacturing production on Chinese inputs (direct and indirect) increased by 3.2 percentage points between 2009 and 2015.
Too much internationalisation? This is no time to put up walls inside the Global Factory
The developments documented above beg the question: “Have international supply chains gone too far?” In most situations, the market tends to produce reasonably efficient outcomes. And given that supply-chain management is marked by highly complex problems and possibilities, masses of information, and rapid change, it is hard to imagine a superior alternative. To paraphrase Winston Churchill, the market is the worst of all possible systems of allocation – except all the others. Nevertheless, the pandemic has prompted many analysts to suggest that a re-evaluate is inevitable.
Javorcik (2020) argues that the Sino-US trade war and Covid-related production disruption will spark a rethinking of global value chains, especially “an excessive reliance on China for supplies.” Javorcik argues that firms “will be forced by their shareholders and rating agencies to … diversify their supplier base to protect against disruptions affecting a particular producer or a particular geographic location.”
But diversification and reshoring are not the same thing. Putting all your eggs in one basket does not diversify risk – even if the basket is at home. “Firms that have diversified suppliers and a production network across different countries can adjust their production when a disaster occurs in one place” (Miroudot 2020). As John Neill, chief executive of the UK logistics and supply chain firm Unipart put it: “I can’t think of a single thing that we could have done if we’d known coronavirus was coming that would have protected us. Factories and operations all over the world have stopped. Let’s say we were sourcing all our requirements in the UK. The government shut down various parts of the UK anyway. So we’d still be in the same position.” (Quoted in Beattie 2020).
Moreover, shifting suppliers is not like changing the allocation between bonds and stocks in your portfolio. As Alan Beattie puts it: “No one’s against resilience the same way no one’s pro-crime. But how?” Quoting Neill again: “Let’s say we wanted to reshore one of those components for fuel tanks to the UK. We would have to put them through a whole range of quality and safety tests to prove to our customers that they meet all their safety requirements. They are rightly incredibly risk averse on a safety-critical product like this.”
To put it differently, supply chains are the way they are today for very good reasons. Sourcing internationally creates flexibilities and resilience. Miroudot (2020) highlights that Korea has effectively shifted much of its in-vitro diagnostics industry towards producing Covid test kits, which are now exported to over 100 countries. This shift was possible because of its deep integration into international supply networks, coupled with its skilled supply chain managers who were reactive and agile in implementing the move.
Concluding remarks
If the world is to ramp up the production of essential medical equipment to meet the swift rise in pandemic-driven demand, there is no alternative to international trade given the integrated nature of global manufacturing. The same is true for the medicines, vaccines, and medical tests that will become important in defeating the virus. Trying to shut down this sort of supply-chain trade will simply make it harder to fight the virus for all nations.
Whatever merits there may be to addressing risk in international supply chains, pursuing this goal in the midst of a pandemic could lead to serious, unintended consequences. Pursuing policies aimed at forcing companies to alter their supply chain practices can easily lead other nations to respond. A spiral of retaliation could disrupt world productive capacity in virtually all manufacturing sectors given the high level of interdependence we documented. This could make economic recovery more challenging, to say the least. In short, keeping trade channels open will help us fight the disease and help the world economy recover.
References
Baldwin, R and J Lopez-Gonzalez (2013). “Supply-chain Trade: A Portrait of Global Patterns and Several Testable Hypotheses,” NBER Working Paper No. 18957, April 2013, eventually published inThe World Economy (2015), vol. 38(11), pages 1682-1721.
Baldwin, R and R Freeman (2020), “The COVID concussion and supply-chain contagion waves,” VoxEU.org, 01 April
Bamber, P, K Fernandez-Stark, and D Taglioni (2020). “Four reasons why globalized production helps meet demand spikes: The case of medical devices and personal and protective equipment,” World Bank Blogs, 12 MAY 2020.
Beattie, A (2020). Financial Times’ Trade Secrets newsletter, 11 May 2020.
Bown, C (2020a), “COVID-19: Demand spikes, export restrictions, and quality concerns imperil poor country access to medical supplies” Chapter 2 in COVID-19 and Trade Policy, Why Turning Inward Won’t Work, Baldwin and Evenett (eds), VoxEU.org eBook, CEPR Press, 2020.
Bown, C (2020b), “COVID-19: China’s exports of medical supplies provide a ray of hope” PIIE Trade and Investment Policy Watch, March 26.
European Parliament (2020). “European Parliament resolution of 17 April 2020 on EU coordinated action to combat the COVID-19 pandemic and its consequences,”
Fiorini, M, B Hoekman, and A Yildirim (2020). “COVID-19: Expanding access to essential supplies in a value chain world,” Chapter 4 in COVID-19 and Trade Policy, Why Turning Inward Won’t Work, Baldwin and Evenett (eds), VoxEU.org eBook, CEPR Press, 2020.
González, A (2020). “Yes, medical gear depends on global supply chains. Here’s how to keep them moving“, VoxEU.org, 01 April 2020.
Javorcik, B (2020). “Global supply chains will not be the same in the post-COVID-19 world,” Chapter 8 in COVID-19 and Trade Policy, Why Turning Inward Won’t Work, Baldwin and Evenett (eds), VoxEU.org eBook, CEPR Press, 2020.
Kilic, K and D Marin (2020). “How COVID-19 is transforming the world economy,” VoxEU.org, 10 May.
Lighthizer, R (2020). “The Era of Offshoring U.S. Jobs is Over,” New York Times, 11 May 2020. https://www.nytimes.com/2020/05/11/opinion/coronavirus-jobs-offshoring.html
Miller, R E and P D Blair (2009). Input-Output Analysis. Foundations and Extensions. Second Edition. Cambridge: Cambridge University Press.
Miroudot, S (2020), “Resilience versus robustness in global value chains: some policy implications” in COVID-19 and Trade Policy, Why Turning Inward Won’t Work, Baldwin and Evenett (eds), VoxEU.org eBook, CEPR Press, 2020.
Annex – calculations and heterogeneity by sector
Our reliance calculations are based on production data. The OECD Inter-Country Input Output tables show the output of all sectors in all nations as well as how much of these are sold as intermediate goods (domestically and abroad) versus final goods (again at home and abroad). From the intermediate-good exports, we can read off the numerator of the observed bilateral reliance measure by sector and importing nation. The denominator is the gross output of the sector-nation under study. As mentioned in the text, this misses the fact that intermediates are used to produce intermediates. Getting to the total reliance measure requires a bit of unremarkable IO matrix algebra: aggregating over the country-sector specific elements of what is well-known as the Leontief inverse matrix (and using the appropriate country-sector gross output weights to do so). As noted in the main text, this is known as total backward linkages, which can alternately be interpreted as the output multiplier (Miller and Blair 2009).
Our measures differ from the well-known value-added measures since we focus on the location of production, not the nationality of the factors used in the production. For instance, to the extent that the Chinese auto-sector pays licensing fees for American technology, some of the trade that we call ‘observed reliance’ in Figure 2 actually consists of value added that ended up in the US, not China. Since our focus is on how trade disruptions might affect manufacturing via interlinkages, the use of production numbers rather than value added numbers seems appropriate to us.
A second point worth noting is that the aggregate numbers in Figures 3 and 4 hide important heterogeneity by sector and by importing nation. This is illustrated in Figure 5 which highlights key interconnected sectors of each hub, including the sector in the data that corresponds most closely to the goods that are most critical in the Covid crisis, namely Chemicals and Pharmaceuticals.
The chart has three panels, one for each hub. Each panel shows the total reliance in 2015 on the corresponding partner (with the dark blue bars); the light-blue diamonds show the level of total reliance in 2009 (during the last global crisis). The left side of Panel A, for example, shows China’s total reliance on US intermediate inputs (from all sectors, not just manufacturing). This is fairly high, 10%, for Other Transport Equipment, and this figure has climbed significantly since 2009. By contrast, the dependence is under 5% for Chemicals and Pharmaceuticals and has not changed much. The right panel shows the same figures for China’s reliance on inputs from Germany. The other two panels show analogous figures for Germany (Panel B) and the US (Panel C).
A few main points pop out of the charts. First, while both Germany’s and the US’s exposure to each other and China have increased for almost all sectors, both countries’ reliance on Chinese inputs has outpaced reliance on each other. This is another illustration of the emergence of China as the ‘workshop of the world’. Second, the aggregate figures on total reliance presented in Figure 3 mask a significant amount of sectoral heterogeneity. For example, while about 9% of US total manufacturing relied on Chinese inputs in 2015, this share was 19% for US production of Motor vehicles, trailers and semi-trailers (Figure 5C).
Third, several of the same sectors face exposure to other manufacturing hubs’ inputs. For example, as shown in Panels B and A, 17% of Germany’s Computer, electronic, and optical products production relies on Chinese inputs, but German inputs rank second in terms of Chinese production in this sector as well. Similarly, as shown in Panels B and C, a similar share of US and German inputs are used in each other’s production of Motor vehicles, trailers and semi-trailers. Fourth, countries worldwide are much more integrated than they were in 2009, with reliance on China being especially marked.
Figure 5 Total reliance of China, Germany, and the US on each other’s manufacturing
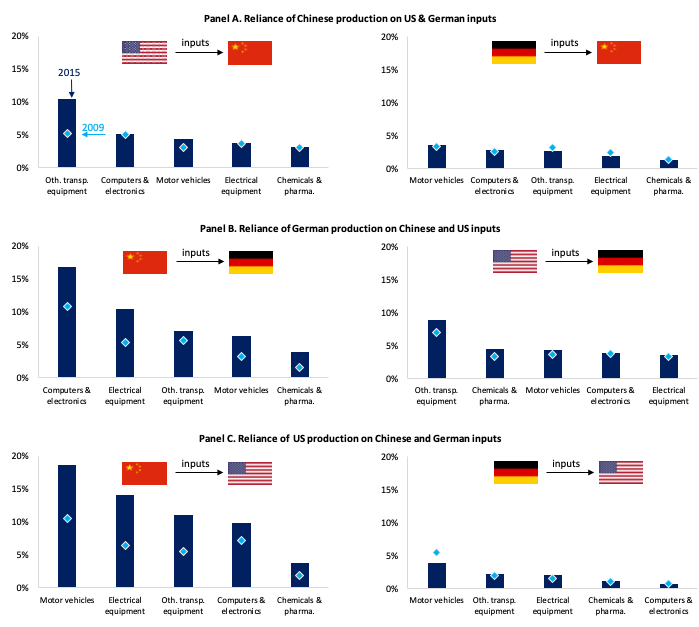
Source: Authors’ computations based on OECD ICIO Tables (available online at: https://www.oecd.org/sti/ind/inter-country-input-output-tables.htm). Notes: The figures are the share of direct and indirect inputs from the each GVC hub in the other hub’s total manufacturing output. For example, the first bar in the left figure of Panel A shows that in 2015 the Chinese Other transportation equipment sector sourced 10% of its inputs (both direct and indirect) from the US (versus 5% in 2009). Sector names have been shortened for exposition.
Endnotes
1 This is what Baldwin and Lopez-Gonzalez (2013) call ‘importing to produce’ (I2P).
2 These figures, which are derived from the OECD Inter-Country Input Output (ICIO) Tables, are available only through 2015.
3 In the input-output literature, this is also referred to as total backward linkages (direct and indirect), which can be interpreted as the output multiplier (chapter 6 and section 12.2.1 of Miller and Blair 2009). See Annex for further details.
4 Underlying figures for years 2009 & 2015 available from the authors upon request.223